

How to Troubleshoot Cloud Data Warehouse Issues
Cloud data warehouses promise speed and scalability, but common issues like slow queries, connection failures, and inefficient storage can quickly increase costs and reduce productivity. Fixing these problems requires identifying the actual bottlenecks - whether related to I/O, network, CPU, or data organization - and addressing them systematically. Here’s a quick summary of solutions:
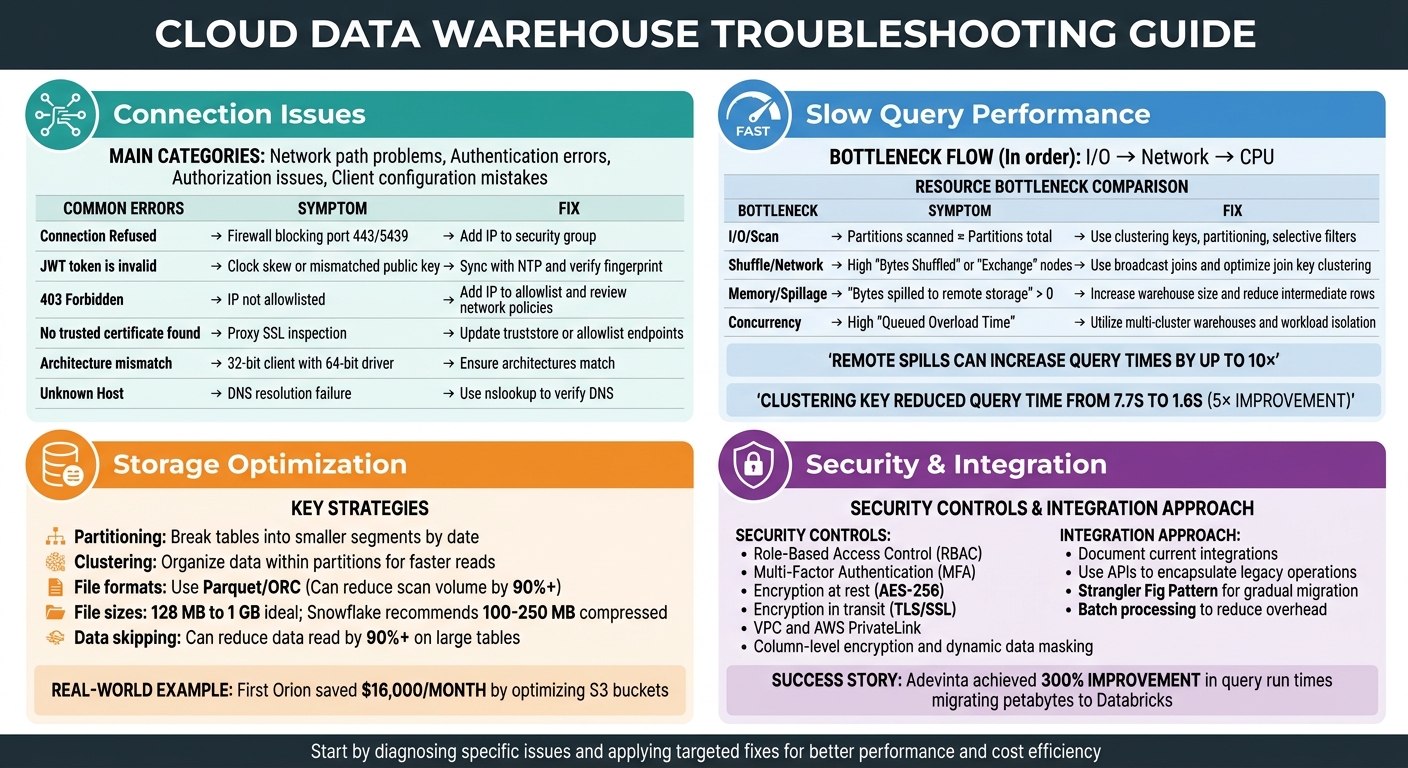
- Connection Issues: Check network paths, credentials, permissions, and driver configurations. Use tools like
ncortelnetto test connectivity. Address common errors like "Connection Refused" or "JWT token is invalid" by reviewing firewalls, clocks, and IP allowlists. - Slow Queries: Analyze query execution plans to identify bottlenecks in I/O, network shuffles, or CPU. Optimize with partitioning, clustering, and join hints. Avoid memory spillage and data skew by reducing intermediate data and filtering early.
- Storage Optimization: Use partitioning and clustering to minimize data scans. Choose efficient file formats (e.g., Parquet) and right-size files to improve performance and reduce costs. Enable data skipping and keep metadata updated to avoid unnecessary reads.
- Security and Integration: Implement role-based access, encryption, and network isolation. Securely connect legacy systems with APIs and batch processing while maintaining data governance.
Every optimization you make saves time and money. Start by diagnosing specific issues and applying targeted fixes for better performance and cost efficiency.
Cloud Data Warehouse Troubleshooting Guide: Common Issues and Solutions
Azure SQL Data Warehouse Common Query Issues
sbb-itb-61a6e59
Fixing Connection Problems
Connection issues generally fall into four main categories: network path problems (like firewalls or proxies blocking traffic), authentication errors (such as incorrect credentials or expired tokens), authorization issues (missing permissions), and client configuration mistakes (like mismatched driver versions or incorrect account identifiers).
Start with Basic Connectivity
The first step is to check if the network connection itself is working. Use commands like nc -zv <hostname> <port> or telnet <hostname> <port> to test if the required port is open. If these commands fail, it usually means a firewall or security group is blocking the connection, not an issue with your application settings.
Once you confirm basic connectivity, move on to reviewing your configuration and analyzing any error messages.
Common Network Issues
Network intermediaries like firewalls or proxies often cause errors such as "Connection Reset" or "SSL Handshake Failed." These devices might inspect SSL traffic or terminate idle connections. If you encounter certificate errors, it could mean your proxy is intercepting SSL traffic. To fix this, configure the proxy to allow traffic to your data warehouse endpoints or update your client’s truststore with the proxy's certificate.
Authentication Problems
For authentication errors, verify your username and ensure it matches the internal LOGIN_NAME (which might differ from the display name). If you're using JWT-based authentication, make sure your client machine's clock is synced with an NTP server - Snowflake rejects tokens received more than 60 seconds after their issue time. Use the DESCRIBE USER <username> command to compare the RSA_PUBLIC_KEY_FP with your client’s fingerprint.
Configuration Details Matter
Account identifiers are another common stumbling block. Make sure you’re using the correct format, such as orgname-accountname or xy12345.region, instead of a full URL. Using the wrong format can lead to "instance not found" errors. Also, ensure that your JDBC or ODBC driver architecture (32-bit or 64-bit) matches your client application. A mismatch can prevent successful connections.
Connection Settings and Authentication
Double-check your username, password, and account identifier. When connecting to Snowflake, always use the format orgname-accountname, not the full URL. For legacy accounts, include the correct region suffix, such as xy12345.us-east-1.
If you're running into IP restrictions, make sure your client’s IP address or CIDR range is added to the allowlist or your VPC security group. If you're using a VPN or proxy, their IP addresses need to be allowlisted as well.
Driver versions and keepalive settings can also impact connection stability. Snowflake JDBC drivers (v3.13.30 and later) have a default 1-minute idle timeout to prevent load balancers from dropping connections. To avoid firewalls terminating long-running connections, set tcp_keepalive_time to 200 seconds on Linux or KeepAliveTime to 30 seconds (30,000 milliseconds) in the Windows registry.
If connections hang, it might be due to an MTU mismatch. Standard Ethernet frames use an MTU of 1,500 bytes, so ensure your client’s MTU is set accordingly.
Decoding Error Messages
Error messages can provide valuable clues about where the connection is failing:
- "Connection Refused" or timeouts often mean a firewall is blocking the port (e.g., port 443 for Snowflake or 5439 for Redshift). Add your client’s IP to the firewall or security group’s inbound rules.
- "JWT token is invalid" typically points to clock skew or a mismatched public key. Sync your client’s clock with an NTP server and verify the fingerprint using
DESCRIBE USER. - "403 Forbidden" usually indicates that your IP isn’t allowlisted or that there are network policy restrictions.
Quick Reference for Common Errors
| Error Message | Likely Cause | Recommended Fix |
|---|---|---|
| Connection Refused | Firewall blocking port 443/5439 | Add your client’s IP to the security group’s inbound rules. |
| JWT token is invalid | Clock skew or mismatched public key | Sync with NTP and verify the fingerprint using DESCRIBE USER. |
| 403 Forbidden | IP not allowlisted or network policy restrictions | Add your IP to the allowlist and review network policies. |
| No trusted certificate found | Proxy SSL inspection affecting certificate trust | Update truststore or allowlist endpoints in proxy settings. |
| Architecture mismatch | 32-bit client with 64-bit driver | Ensure client and driver architectures match. |
| Unknown Host | DNS resolution failure | Use nslookup <hostname> to verify DNS resolution. |
One common issue is an architecture mismatch, where a 32-bit client tries to use a 64-bit driver. This often happens with older applications, like legacy versions of Excel, attempting to use modern ODBC drivers. Fixing this requires ensuring that both the client and driver are either 32-bit or 64-bit.
Speeding Up Slow Queries
Once you've tackled connection issues, the next step is improving query performance. Just like fine-tuning configurations can enhance connectivity, understanding your query's execution plan is crucial to identifying and fixing slow queries.
Slow queries often result from three main bottlenecks, typically occurring in this order: I/O (reading data from storage), Network (transferring data between nodes), and CPU (processing logic). The key is figuring out where your query is spending most of its time.
Analyze Query Execution Plans
Most platforms offer tools to help you visualize how queries are executed. For example, Snowflake provides the Query Profile, BigQuery uses the Execution Graph, and Databricks offers the EXPLAIN command. These tools break down your SQL into a Directed Acyclic Graph (DAG) of operators like TableScans, Joins, and Aggregates. This breakdown helps pinpoint exactly where time is being consumed.
"The Snowflake Query Profile is the single best resource you have to understand how Snowflake is executing your query and learn how to improve it."
– Ian Whitestone, Co-founder & CEO, SELECT
Focus on the "Most Expensive Nodes" or "Top Operators" in the execution plan, as these represent the operations using the largest share of execution time. For instance, if the number of partitions scanned is nearly equal to the total available partitions, this could mean your query isn't leveraging partition pruning effectively, leading to unnecessary data reads.
Also, watch for "Exchange" or "Shuffle" steps in the execution plan. High shuffle output bytes suggest costly data movement across the network. In BigQuery, a "High Cardinality Join" insight may flag inefficient join keys when the ratio of output rows to input rows is unusually high. If a large table is being shuffled unnecessarily while a smaller table could be broadcast, you can use join hints like /*+ BROADCAST(table) */ to enforce a more efficient execution strategy.
Once you've identified the slowest parts of the query, you can tackle the resource bottlenecks to improve performance further.
Fix Resource Bottlenecks
Two major culprits for slow queries are memory spillage and data skew. Memory spillage occurs when intermediate query results exceed available memory and are written to local SSDs or, worse, to remote storage like S3 or Azure Blob. Remote spills can increase query times by up to 10×. If you see "Bytes spilled to remote storage" in your execution plan, consider increasing your warehouse size to provide more memory.
Data skew, on the other hand, happens when a single join key has too much data, creating straggler tasks that slow down the entire query. To address this, you can filter data earlier in the query or use approximate functions like APPROX_COUNT_DISTINCT to reduce the overall data volume.
For concurrency issues, high "Queued Overload Time" indicates your warehouse has reached its capacity, causing queries to wait in line. Instead of simply increasing the warehouse size, consider scaling out with multi-cluster warehouses to handle more concurrent workloads.
| Bottleneck Type | Diagnostic Indicator | Primary Fix |
|---|---|---|
| I/O / Scan | Partitions scanned ≈ Partitions total | Use clustering keys, partitioning, and selective filters |
| Shuffle / Network | High "Bytes Shuffled" or "Exchange" nodes | Use broadcast joins and optimize join key clustering |
| Memory / Spillage | "Bytes spilled to remote storage" > 0 | Increase warehouse size and reduce intermediate rows |
| Concurrency | High "Queued Overload Time" | Utilize multi-cluster warehouses and workload isolation |
Lastly, avoid wrapping partitioned or clustered columns in functions within your WHERE clause. For example, using date >= '2024-01-01' allows partition pruning, while YEAR(date) = 2024 forces a full table scan. A small mistake like this can turn a query that scans just 1% of your data into one that scans the entire dataset.
Organizing Data for Better Performance
Organizing your data can significantly improve query speed and lower costs by reducing the amount of data scanned during processing.
Set Up Partitioning and Clustering
Partitioning breaks down tables into smaller segments - often by date - so the query engine can skip over entire sections of data that don't match your filters. Clustering takes it a step further by organizing data within those partitions, making it easier for the engine to avoid unnecessary reads using zone maps.
For example, in a Snowflake table with 600 million records, applying a clustering key on l_shipdate cut query execution time from 7.7 seconds to just 1.6 seconds. This improvement came from reducing the number of micro-partitions scanned - nearly a fivefold boost.
"The single most impactful optimization is to select only the columns you need."
– Nawaz Dhandala, Author, OneUptime
Different platforms handle clustering and partitioning in their own ways. Snowflake uses clustering keys on micro-partitions (50–500 MB uncompressed), BigQuery employs CLUSTER BY, and Redshift relies on sort keys. In distributed systems like Redshift, setting distribution keys (e.g., user_id) ensures matching rows are stored on the same compute node, avoiding costly network shuffles.
When choosing keys, think about your query patterns. For instance, if your queries filter by date first and then by user, a compound key like (event_date, user_id) works well. For large, disorganized tables, reorganize data using an INSERT OVERWRITE or CREATE TABLE AS SELECT (CTAS) statement with an ORDER BY clause, all in one transaction.
Choose the Right File Formats and Sizes
Using columnar file formats like Parquet and ORC can drastically reduce scan volumes and speed up query performance. Pair these formats with optimal file sizes - 128 MB to 1 GB is ideal - to further enhance processing efficiency. Selecting only the necessary columns in a wide table can reduce scan volume by over 90%.
Snowflake suggests compressed file sizes between 100–250 MB for better parallel operations and lower Snowpipe overhead. On Databricks, aim for 128 MB with "Auto-optimize" and up to 1 GB when using "Optimize" commands.
"When a table has too many underlying tiny files, read latency suffers as a result of the time spent for just opening and closing those tiny files."
– Himanshu Arora and Prashanth Babu Velanati Venkata, Databricks
Avoid oversized files, especially those exceeding 100 GB, as they can lead to load delays, higher costs, or memory failures - particularly when using unsplittable compression formats like GZIP. Instead, opt for splittable compression options like Snappy (default for Parquet) or BZ2/LZO.
In 2024, First Orion fine-tuned their Unity Catalog S3 buckets by disabling unnecessary object versioning and applying lifecycle policies. This saved them around $16,000 per month in storage costs. They also reduced expenses by routing S3 traffic through S3 Gateway Endpoints instead of NAT Gateways, eliminating the $0.045 per GB data processing fee.
Once file formats and sizes are optimized, enable data skipping to further reduce unnecessary scans.
Enable Data Skipping and Metadata Pruning
Data skipping lets the query engine bypass irrelevant files or partitions by using metadata like minimum and maximum values, null counts, and record totals. This can reduce the data read by 90% or more on large tables. Databricks, for instance, collects data skipping stats for the first 32 columns by default. If your filter columns go beyond this range, you can configure them using the dataSkippingStatsColumns property. After making significant data changes, run ANALYZE TABLE table_name COMPUTE DELTA STATISTICS to keep metadata updated.
In Snowflake, monitor the "Partitions Scanned vs. Partitions Total" metric in the Query Profile. If these numbers are nearly identical, partition pruning isn't working effectively, and adding a clustering key might help. Also, avoid wrapping partition columns in functions; instead, use direct comparisons like WHERE date_col >= '2026-01-01'.
Managing Security and System Integration
Securing your data warehouse while ensuring seamless integration with other systems calls for a multi-layered strategy. This approach should address identity management, network isolation, and data governance to maintain both security and efficiency.
Apply Security Controls
Start by enforcing Role-Based Access Control (RBAC) and requiring Multi-Factor Authentication (MFA). To minimize risks, configure the data warehouse to be read-only by default for most users. This reduces the chances of accidental deletions or unauthorized SQL write operations. Protect sensitive data with encryption at rest (using AES-256) and encryption in transit (using TLS/SSL) to safeguard it during storage and transfer. These measures not only enhance security but also help maintain data integrity, ensuring that query performance isn't compromised.
For deployment, consider using a Virtual Private Cloud (VPC) and private connectivity options like AWS PrivateLink to keep your data inaccessible from public networks. For highly sensitive fields - such as Social Security numbers or credit card data - apply column-level encryption or dynamic data masking. This allows analysts to work with the data without exposing its raw values. Additionally, implement row-level security to limit access to specific records based on a user’s department or role.
Cloud data breaches are often caused by exposed storage buckets or overly permissive firewall rules. Use Cloud Security Posture Management (CSPM) tools to scan for vulnerabilities. Automate user provisioning to ensure access is revoked as soon as employees leave the organization. Regularly audit user permissions and access logs to identify outdated accounts or potential security gaps.
Once security is solidified, the next hurdle is integrating legacy systems without hindering modern workflows.
Connect Legacy Systems
Integrating legacy systems into modern data warehouses requires careful planning and a phased approach. Begin by documenting all current integrations, such as scripts, file drops, and batch jobs. This groundwork will guide your migration strategy. To maintain continuity, encapsulate stable legacy operations within APIs. Use the Strangler Fig Pattern to gradually route new workflows through a modern layer while phasing out older components. To keep your platform logic clean, implement an anti-corruption layer that bridges legacy and modern data models.
When establishing connections, you can use options like direct database links (JDBC/ODBC), RESTful APIs for third-party tools, or file-based ingestion from cloud storage.
"Integration projects that start with a platform selection almost always drift. The platform becomes the goal, and the business problem becomes secondary."
– r4.ai
Store credentials securely in vaults or environment variables rather than hard-coding them into scripts. To optimize performance, use batch processing to reduce overhead and parallelize requests. This helps maximize bandwidth and improves efficiency. Implement automated schema validation and error handling to catch malformed records from external sources. Additionally, log timestamps, source identifiers, and error details to quickly pinpoint and address ingestion failures.
A great example of successful integration comes from Adevinta. In June 2021, after acquiring eBay Classifieds Group, they migrated petabytes of data - including a 500 TB Google Analytics table - to Databricks SQL. By converting Parquet files to Delta format and using Z-ordering to reduce data scans, they achieved a 300% improvement in query run times and significantly boosted system availability.
Summary and Next Steps
Start by diagnosing issues using tools like QUERY_HISTORY and Query Profiles to pinpoint bottlenecks such as warehouse contention, inefficient pruning, disk spillage, or problematic joins. As DataCouch aptly notes:
"The key isn't just knowing the fixes, but learning how to diagnose the right problem first".
This diagnostic-first approach connects all the earlier techniques - like troubleshooting connections, optimizing queries, and organizing data - into a cohesive strategy for maintaining warehouse performance. For example, in September 2024, Senior Data Engineer Sanjeet Shukla tackled a Snowflake query slowdown where execution time ballooned from 3 minutes to over 10 minutes. By using SYSTEM$CLUSTERING_INFORMATION, he uncovered poor clustering metrics (an average_overlaps of 68 compared to a healthy 0.5). After updating the cluster key on a 2XL warehouse, the process took 20 minutes and cost $21.32, but it brought query time back down to 2.5 minutes.
Make it a habit to review your top 10 most expensive queries regularly, set up Resource Monitors to prevent runaway queries, and standardize SQL to take full advantage of Snowflake's 24-hour result cache.
Beyond troubleshooting, moving toward proactive optimization can lead to significant cost reductions and performance improvements. Hands-on training with real-world scenarios plays a key role here. Programs like those offered by DataExpert.io Academy provide targeted boot camps in areas like data engineering, analytics engineering interviews, and AI engineering. These sessions focus on practical skills, including working with tools like Databricks, Snowflake, and AWS, and include capstone projects, guest speakers, and advanced diagnostic training. This kind of structured practice helps refine your ability to identify and resolve performance issues effectively.
In the world of cloud data warehousing, time is money. Every optimization you make not only cuts costs but also enhances performance. Start applying these methods now, and continue sharpening your skills through hands-on experience and advanced learning opportunities.
FAQs
How do I tell if a slow query is I/O, network shuffle, or CPU bound?
To figure out whether a slow query is tied to I/O, network shuffle, or CPU limitations, start by examining the query execution plan or profile. If you notice high levels of I/O activity, it’s a sign of I/O bottlenecks. On the other hand, if there are excessive shuffle operations, the issue might stem from network constraints. When operators like joins or sorts take an unusually long time, especially with large datasets, it’s likely the query is CPU-bound. Zero in on the operators consuming the most resources to identify the root cause.
What’s the fastest way to fix remote spill and data skew?
To address remote spill efficiently, leverage diagnostic tools such as Snowflake’s Query Profile. These tools help pinpoint resource-intensive operations, like full table scans. Once identified, you can optimize the queries or adjust the warehouse size to handle the workload better.
When it comes to data skew, early detection is key. Look for uneven task durations or imbalances in data distribution. To fix this, consider strategies like repartitioning or using skew join hints. These approaches help distribute data more evenly across partitions, leading to better performance.
How do I choose the right partitioning and clustering keys for my workload?
To make the most of partitioning and clustering keys in a cloud data warehouse like Snowflake, it's crucial to align your choices with your data and query patterns. Prioritize columns that are commonly used in filters or joins - think dates or categories. These selections can enhance micro-partition pruning, leading to better query performance. Take the time to test various keys and analyze how they affect both performance and cost, ensuring they fit the unique demands of your workload.